4. Benchmarking
This guide provides an overview of the most important functionality of the benchmarking facilities provided by Auswahl.
The benchmarking is intended to provide Auswahl with a native mean of a quick and out-of-the-box evaluation and comparison
of different selector algorithms. The main component of the benchmarking framework is the function benchmark().
The first parts of this guide will elaborate on the interface of the function benchmark(),
while the remaining parts will showcase the handling of the results generated by the benchmarking function. We recommend
to get a quick overview of the documented interface of benchmark() before proceeding with this guide.
4.1. Data sets
The benchmarking system can evaluate the performance of SpectralSelector methods across several data sets simultaneously in order to provide a
unified comparison of selection algorithms across a number of studied scenarios.
The data set configurations provided to the benchmarking function each consist of a tuple specifying four items. Namely
![]0,1[](_images/math/b63cd7d954cc92718c28240b385d83d707ccf559.png) indicating the share of the data to be used for fitting of the selection algorithms
indicating the share of the data to be used for fitting of the selection algorithmsAn example invocation of benchmark() with several data sets is given below:
result = benchmark(data=[(X, y, 'first dataset', 0.90),
                         (X2, y2, 'second_dataset', 0.8)],
                   features=[10, 15, 20],
                   methods=[CARS(), VIP()],
                   n_runs=10)
4.2. Selectors
The benchmarking system can handle all selectors extending the class SpectralSelector. Especially, the system can benchmark algorithms of
the subclasses PointSelector and IntervalSelector simultaneously. In the data handling of the benchmarking system
and all derived functionalities, such as the plotting, the selectors are addressed by their class name. If these are not unique
(for instance during benchmarking of differently configured instances of the same selector algorithm),
or custom names are desired for other reasons, the names can be specified for the selectors as exemplified below:
result = benchmark([(X, y, 'data_example', 0.25)],
                   features=[10, 15, 20],
                   # provide unique names here
                   methods=[(CARS(), "first_cars"), (CARS(n_cars_runs=10), "second_cars")],
                   n_runs=10)
4.3. Features to select
The benchmarking system allows the comparison of feature selection algorithms across several feature configurations.
For the PointSelector the configurations of features to be selected are simply specified by a single integer. For selectors extending IntervalSelector
a feature selection configuration requires the description of both the width of an interval (that is a consecutive block of wavelengths) and a number of
such intervals to be extracted by the algorithm. Such a configuration is specified with a tuple (number of intervals, interval width). If the methods to be benchmarked
comprise at least one selector extending IntervalSelector, all feature configurations need to be specified in the above defined interval fashion. For
PointSelector the interval configurations will be resolved by selecting  many features.
An example for such a scenario is given below:
many features.
An example for such a scenario is given below:
result = benchmark([(X, y, 'data_example', 0.25)],
                    #The IntervalSelector FiPLS is benchmarked. Specify the feature configurations for which the algorithms
                    #are to be tested as intervals (#intervals, interval width)
                    features=[(10, 5), (20, 5), (5, 10)],
                    methods=[CARS(), FiPLS()],
                    n_runs=10)
4.4. Metrics
The benchmarking system distinguishes between two different kinds of metrics, namely regression metrics and stability metrics.
While the former is a compulsory component of the benchmarking (and set to sklearn.metrics.mean_squared_error() per default),
the stability metric is optionally calculated by the benchmarking system. The system can handle several metrics of each kind simultaneously.
4.4.1. Regression Metrics
The benchmarking system can handle all regression metrics, which follow the convention of the metric functions of sklearn, such as
sklearn.metrics.mean_squared_error() or sklearn.metrics.mean_absolute_error().
4.4.2. Stability Metrics
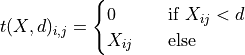
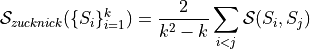
The stability is a metric quantifying the degree of feature fluctuation of feature selection algorithms across several executions with equal or varying data splits. The stability is a well-established characteristic considered in the feature selection literature and often juxtaposed with the regression quality of the features selected by an algorithm. It can be argued, that the stability of a selection algorithm is a confluence of both the amount of randomization deployed in the algorithm and the degree to which randomization is modulated by the algorithm through feedback from interactions with the data. This might allow for many or few different sets of features with high explanatory power, depending on its characteristics. Some of these characteristics of data are innate to their acquisition domain. An ubiquitous property of spectral data is its high degree of multicollinearity, that is a high degree of linear dependence and redundancy between different features. The more conventional stability metrics, which are based on set-theoretical considerations such as the Intersection-over-Union, can therefore be considered as not entirely adequate for the stability assessment in the regime of spectral feature selection and many other domains. The set-theoretical approaches have therefore been complemented with metrics introducing correlation-adjustment mechanisms into the stability evaluation.
For the benchmarking functionality provided in Auswahl, two stability assessment metrics are provided directly.4.4.2.1. Deng Score
The Deng-score is a set-theoretical stability measure without any means of correlation-adjustment.
The metric considers two sets of selections of features  and
and  of size
  out of
  features
and quantifies the degree of overlap adjusted by the expected random overlap
features
and quantifies the degree of overlap adjusted by the expected random overlap 
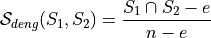
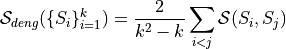
For sets of selections  , the score is averaged across all pairs
The metric is available for benchmarking with class DengScore
References:
Bai-Chuan Deng, Yong-Huan Yun, Pan Ma, Chen-Chen Li, Da-Bing Ren and Yi-Zeng Liang, ‘A new method for wavelength interval selection that intelligently optimizes the locations, widths and combination of intervals’, Analyst, 6, 1876-1885, 2015.
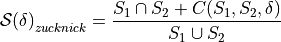
4.4.2.2. Zucknick Score
The Zucknick score aims to account for the high collinearity in spectral data, by incorporating a correlation adjustment mechanism into the stability evaluation.
To that end the Zucknick-Score considers the Intersection-over-Union adjusted with a correlation contribution  .
The metric considers two sets of selections of features and of size :
.
The metric considers two sets of selections of features and of size :
where is defined as

where in turn  is defined as
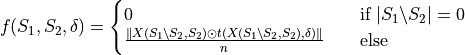
where  is the correlation matrix between the features in and ,
  the elementwise multiplication
and
the elementwise multiplication
and  a thresholding function operating on matrix
  using threshold
  , such that
The parameter  can be selected by the users as a threshold for the minimum required correlation between
two features for them to be considered similar.
can be selected by the users as a threshold for the minimum required correlation between
two features for them to be considered similar.
For sets of selections , the score is averaged across all pairs
The metric is available for benchmarking with class ZucknickScore
References:
Zucknick, M., Richardson, S., Stronach, E.A.: Comparing the characteristics of gene expression profiles derived by univariate and multivariate classification methods. Stat. Appl. Genet. Molecular Biol. 7(1), 7 (2008
4.4.2.3. Adding Stability Metrics
In order to add custom stability metrics to the benchmarking system, the inheritance from StabilityScore
and the implementation of evaluate_stability() is mandatory.
For stability metrics defined as average over symmetric stabilities between pairs of sets of selected features,
consider extending the class PairwiseStabilityScore:
class MyScore(PairwiseStabilityScore):

    def __init__(self, metric_name, *my_args, **my_kwargs):
        super().__init__(metric_name)

    def pairwise_sim_func(self, meta_data: dict, set_1: np.ndarray, set_2: np.ndarray) -> float:

        #
        # Calculate the stability between the pair of feature sets set_1 and set_2
        #

        # access meta information of the data set, if required
        total_number_of_features = meta_data['n_features']
        return 0
The user is only required to overwrite the method pairwise_sim_func() to calculate and return
the stability between a pair of sets of selected features. If the stability calculation requires information about the dataset (such as correlation information), the
data can be accessed via the provided meta_data. See get_meta for an overview over the returned data.
If there is no recourse to the superclass PairwiseStabilityScore, the
method evaluate_stability() provides the user
with an array of all selections.
4.4.2.4. Using Metrics
The evaluation metrics can be passed as lists if the evaluation of several metrics is desired.
When accessing the results of the evaluation, the regression metrics are referred to by their function name. The stability
metrics can be arbitrarily named, but are per default named with their camelcase class name separated by an underscore (like zucknick_score).
An example invocation can be seen here:
result = benchmark([(X, y, 'data_example', 0.25)],
                   features=[10, 15, 20],
                   reg_metrics=[mean_squared_error, mean_absolute_error],
                   stab_metrics=[DengScore(), ZucknickScore(metric_name='custom_name',
                                                            correlation_threshold=0.9)]
                   methods=[CARS(), VIP()],
                   n_runs=10)
4.5. Benchmarking Results
This section elaborates on the structure and further handling of the data returned by the benchmarking.
4.5.1. Output structure and retrieval
The function benchmark() returns the results of the evaluation as an instance of class DataHandler which
aggregates the evaluation results curated into four categories:
Regression
Regression results for all selection algorithms, all benchmarked datasets, all regression metrics, all feature selection configurations
and all sample runs of the algorithms. The data is aggregated as a pandas.DataFrame with the selection algorithms (by their names)
in the index and a pandas.MultiIndex in its columns containing the levels
dataset:All available datasets. Key of type
str.
n_features:All available feature configurations. Key of type
int,Tuple[int, int]orFeatureDescriptor
regression_metric:All available regression metrics. Key of type
str
run:All individual sample runs for the particular configurations. Key of type
int
The data can be accessed using method get_regression_data() of class DataHandler.
The method can also be used to slice the frame to a single or selection of items of the various levels.
Stability
Stability results for all selection algorithms, all benchmarked datasets, all stability metrics and all feature selection configuration. The data is aggregated as a
pandas.DataFrame with the selection algorithms (by their names) in the index and a pandas.MultiIndex in its columns containing the levels
dataset:All available datasets. Key of type
str.
n_features:All available feature configurations. Key of type
int,Tuple[int, int]orFeatureDescriptor
stability_metric:All available regression metrics. Key of type
str
The data can be accessed using method get_stability_data() of class DataHandler.
The method can also be used to slice the frame to a single or selection of items of the various levels.
Execution time
Execution time measurements for all selection algorithms, all benchmarked datasets, all feature selection configuration and all sample runs of the algorithms. The data is aggregated as a
pandas.DataFrame with the selection algorithms (by their names) in the index and a pandas.MultiIndex in its columns containing the levels
dataset:All available datasets. Key of type
str
n_features:All available feature configurations. Key of type
int,Tuple[int, int]orFeatureDescriptor
run:All individual sample runs for the particular configurations. Key of type
int
The data can be accessed using method get_measurement_data() of class DataHandler.
The method can also be used to slice the frame to a single or selection of items of the various levels.
Selection
The indices of selected features for all selection algorithms, all benchmarked datasets, all feature selection configuration and all sample runs of the algorithms. The data is aggregated as a
pandas.DataFrame with the selection algorithms (by their names) in the index and a pandas.MultiIndex in its columns containing the levels
dataset:All available datasets. Key of type
str
n_features:All available feature configurations. Key of type
int,Tuple[int, int]orFeatureDescriptor
run:All individual sample runs for the particular configurations. Key of type
int
The dataframe contains the sets of selected features as instances of class Selection.
Note, that the DataFrame contains a Selection object also for invalid, that is error raising executions
of the selector algorithms. Make therefore sure to check the validity of the Selection object at hand using
its member function is_valid() .
get_selection_data() of class DataHandler.
The method can also be used to slice the frame to a single or selection of items of the various levels.
4.5.2. Utilization
The retrieved frames can be used for further analysis and inspection using the plenitude of operations pandas provides for DataFrames equipped with
the pandas.MultiIndex.
Note, that the data of error raising executions of the selector algorithms is set to numpy.NaN. The consideration of the results can therefore be
conveniently restricted to the valid executions, by using the nan-ignoring functions of pandas.
An example is given below:
x = np.load("./data/spectra.npy")
y = np.load("./data/targets.npy")

result = benchmark([(x, y, 'test_set', 0.8)],
                    features=[5, 10, 15],
                    methods=[CARS(), VIP()],
                    n_runs=10,
                    random_state=42,
                    reg_metrics=[mean_squared_error, mean_absolute_error],
                    stab_metrics=[DengScore()],
                    n_jobs=2,
                    verbose=True)
# retrieve the mean_squared_error data
mse_data = result.get_regression_data(reg_metric='mean_squared_error')

# group the data per feature configuration and calculate the regression mean across all samples runs
means = mse_data.groupby(axis=1, level=['n_features']).nanmean()
print(means)
Yields for our test data:
n_features         5        10        15
CARS        0.027381  0.027366  0.028535
VIP         0.035211  0.033051  0.032912
Another example considering the selected features of the selection algorithms is given as well:
result = benchmark([(x, y, 'test_set', 0.8)],
                   features=[5, 7, 15],
                   methods=[CARS(), VIP()],
                   n_runs=10,
                   random_state=42,
                   reg_metrics=[mean_squared_error, mean_absolute_error],
                   stab_metrics=[DengScore()],
                   n_jobs=2,
                   verbose=True)

# retrieve the selected features of the first sample run for feature configurations 5 and 15
selection = result.get_selection_data(sample=0, n_features=[5, 7])
print(selection)
Yields for our test data set:
dataset                      test_set
n_features                          5                                 7
run                                 0                                 0
CARS        [166, 178, 530, 551, 559]  [6, 23, 167, 542, 552, 554, 566]
VIP                   [0, 1, 2, 3, 4]             [0, 1, 2, 3, 4, 5, 6]
4.6. Plotting Facilities
Auswahl offers a range of functions for benchmarking visualization. The visualization functions operate directly on the instance of DataHandler returned by the
function benchmark() and offer a variety of options for slicing the benchmarking results for a selective representation of the evaluation. Refer to the API for an overview over all provided functions.
The example below showcases the deployment of some of the functions:
result = benchmark([(x, y, 'test_set', 0.8)],
features=[5, 7, 10, 15],
methods=[CARS(), VIP(), MCUVE()],
n_runs=10,
random_state=42,
reg_metrics=[mean_squared_error, mean_absolute_error],
stab_metrics=[DengScore(), ZucknickScore()],
n_jobs=2,
verbose=True)
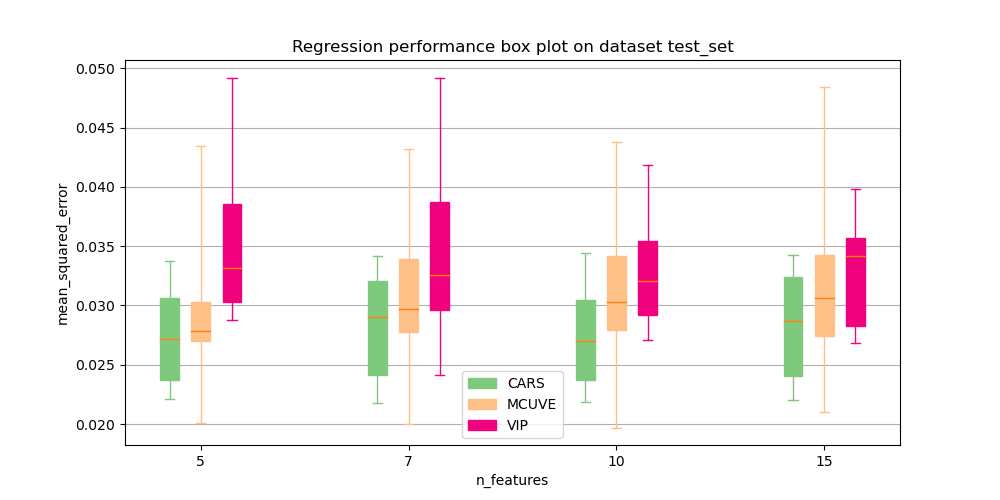
# plot the regression score for the mean_squared_error for all selectors and feature configurations
plot_score(result, regression_metric='mean_squared_error', save_path="doc/images/score.png")
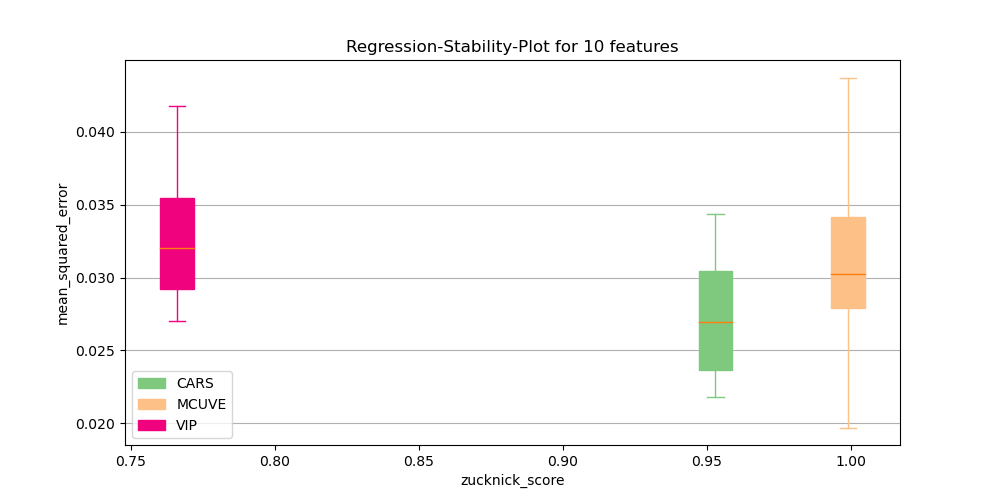
# contrast regression score and selector stability for feature configuration of 10 features to be selected
plot_score_vs_stability(result, n_features=10, regression_metric="mean_squared_error", stability_metric='zucknick_score', save_path="doc/images/reg_stab.png")
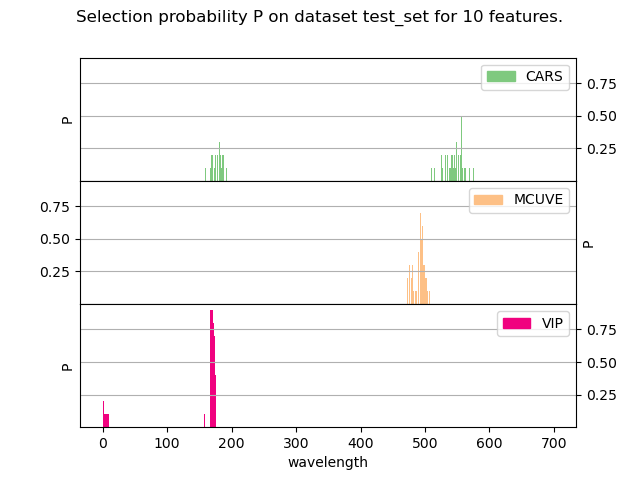
# plot the selection probability of each feature for every selector
plot_selection(result, n_features=10, save_path="doc/images/selection.png")
The following gallery illustrates the resulting plots
4.7. Error logging
The benchmarking system catches possible errors during the evaluation of the different selectors and provides an overview of the raised
errors in an error logging file. Apart from the exception message and stacktrace, an indication is provided at which point during the
benchmarking process the error was raised and reproduction information is disclosed comprising the dataset, the feature configuration, the specific selector, and the seed used
for the data splitting and for the configuration of the selector.
The information about the error is provided in the json-format.
The file path for the error log can be provided to benchmark().
The format of the error_log is given below:
{
"error 1": {
    "dataset": "test_set",
    "severity": "fatal",
    "features": "5",
    "run": 0,
    "seed": "121958",
    "method": "ExceptionalSelector",
    "during": "Fitting of Selector",
    "type": "NotImplementedError",
    "message": "This function is not meaningfully implemented",
    "trace": "NotImplementedError: This function is not meaningfully implemented\n"
    }
}
4.8. Miscellaneous
4.8.1. Reproducibility
The benchmarking has been implemented to be completely reproducible. Invoking the function with the same random seed, yields the equal results as preceding runs.
4.8.2. Parallelization
The benchmarking can be sped up by parallelization. Auswahl uses to that end the process-level parallelism of joblib.
The function benchmark() provides the argument n_jobs for the configuration of the number
of parallel processes. Note, that benchmark() overrides possible n_jobs configurations in
its provided selector algorithms:
The selector algorithms are all executed in a non-parallel fashion, as the benchmarking parallelizes the execution of the
different sample runs of the selector algorithms. Make therefore sure to provide benchmark() with the correct configuration of available hardware parallelism.
4.8.3. Loading and Storing
The benchmarking results of type DataHandler can be pickled using
its member function store(). The DataHandler instance
can later be reloaded using the function load_data_handler()