Note
Click here to download the full example code
MC-UVE - Basic example
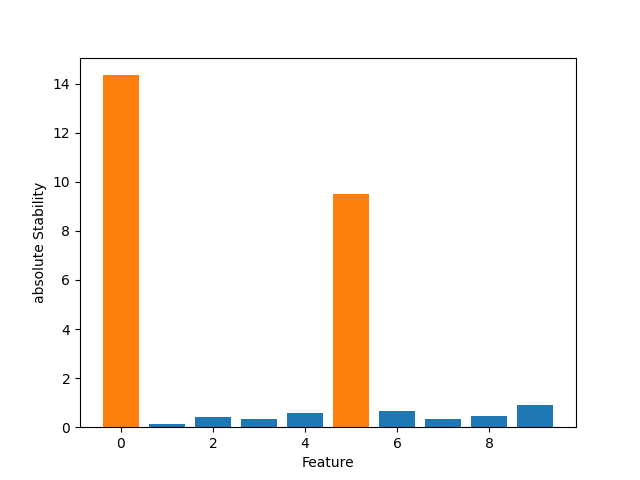
An MC-UVE example showing the feature importance for a synthetic regression task.
The example uses a synthetic dataset with 10 standard normally distributed features. The target values only depend on two features: #0 and #5. If the MC-UVE method is tasked with selecting two features, it identifies the two important features as shown below.
import matplotlib.pyplot as plt
import numpy as np

from auswahl import MCUVE

np.random.seed(1337)
X = np.random.randn(100, 10)
y = 5 * X[:, 0] - 2 * X[:, 5]

mcuve = MCUVE(n_features_to_select=2)
mcuve.fit(X, y)

colors = np.full(X.shape[1], fill_value='C00')
colors[mcuve.get_support()] = 'C01'

plt.bar(x=np.arange(X.shape[1]), height=abs(mcuve.stability_), color=colors)

plt.xlabel('Feature')
plt.ylabel('absolute Stability')

plt.show()
Total running time of the script: ( 0 minutes 0.208 seconds)