auswahl.benchmarking.plot_score
- auswahl.benchmarking.plot_score(pod: DataHandler, dataset: Optional[str] = None, regression_metric: Optional[str] = None, methods: Optional[Union[str, List[str]]] = None, n_features: Optional[List[Union[int, Tuple[int, int]]]] = None, item: Literal['mean', 'median'] = 'mean', plot_type: Literal['box', 'bar'] = 'box', save_path: Optional[str] = None)[source]
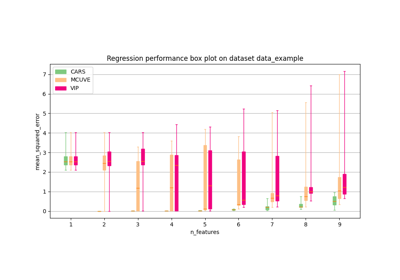
Plot regression scores of selectors across different number of selected features as box or bar plot.
- Parameters
- pod: DataHandler
DataHandlerobject containing the benchmarking data.- dataset: str, default=None
Identifier of the dataset of which to plot the execution time. If there is data for only one dataset in the
DataHandlerobject, the argument does not have to be specified.- methods: str or list of str, default=None
Identifiers of methods for which to plot the execution time. If None, all available methods are used.
- n_features: list of integers or of tuples of integers, default=None
Identifiers of the number of features or the configuration of intervals for which the execution time is to be plotted. If None, all available feature descriptors are used.
- item: Literal[‘mean’, ‘median’], default=’mean’
Specifies whether the mean or median is displayed in the plot.
- plot_type: Literal[‘box’, ‘bar’], default=’box’
Specifies the requested plot type.
- save_path: str, default=None
Path at which the plot has to be saved. If None, the plot is only displayed, not saved.