auswahl.benchmarking.plot_score_vs_stability
- auswahl.benchmarking.plot_score_vs_stability(pod: DataHandler, n_features: Optional[Union[int, Tuple[int]]] = None, dataset: Optional[str] = None, stability_metric: Optional[str] = None, regression_metric: Optional[str] = None, methods: Optional[Union[str, List[str]]] = None, save_path: Optional[str] = None)[source]
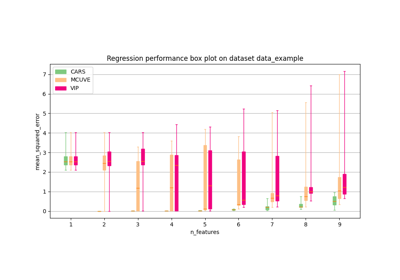
Plotting a boxplot for the benchmarked methods displaying
the mean regression score on the y-axis
mean regression value
(25,75) IQR as box
(0, 100) range as whiskers
the stability score on the x-axis
- Parameters
- podDataHandler
DataHandlerobject containing the benchmarking data.- dataset: str
Dataset for which the data is to be plotted. If there is data for only one dataset in the
DataHandlerobject, the argument does not have to be specified.- n_features: int or tuple of int
Number of features, which were to be selected by the algorithms. If there is data for only one feature configuration in the
DataHandlerobject, the argument does not have to be specified.- stability_metricstr
Identifier of the stability metric to be plotted in the pod. If there is data for only one stability metric in the
DataHandlerobject, the argument does not have to be specified.- regression_metricstr
Identifier of the regression metric to be plotted in the pod. If there is data for only one regression metric in the
DataHandlerobject, the argument does not have to be specified.- methodsstr or list of str, default=None
Identifiers of methods for which the data is to be plotted. If None, all available methods are plotted.
- save_path: str, default=None
Path at which the plot is stored. If None, the plot is just displayed.